ODC to PNG API
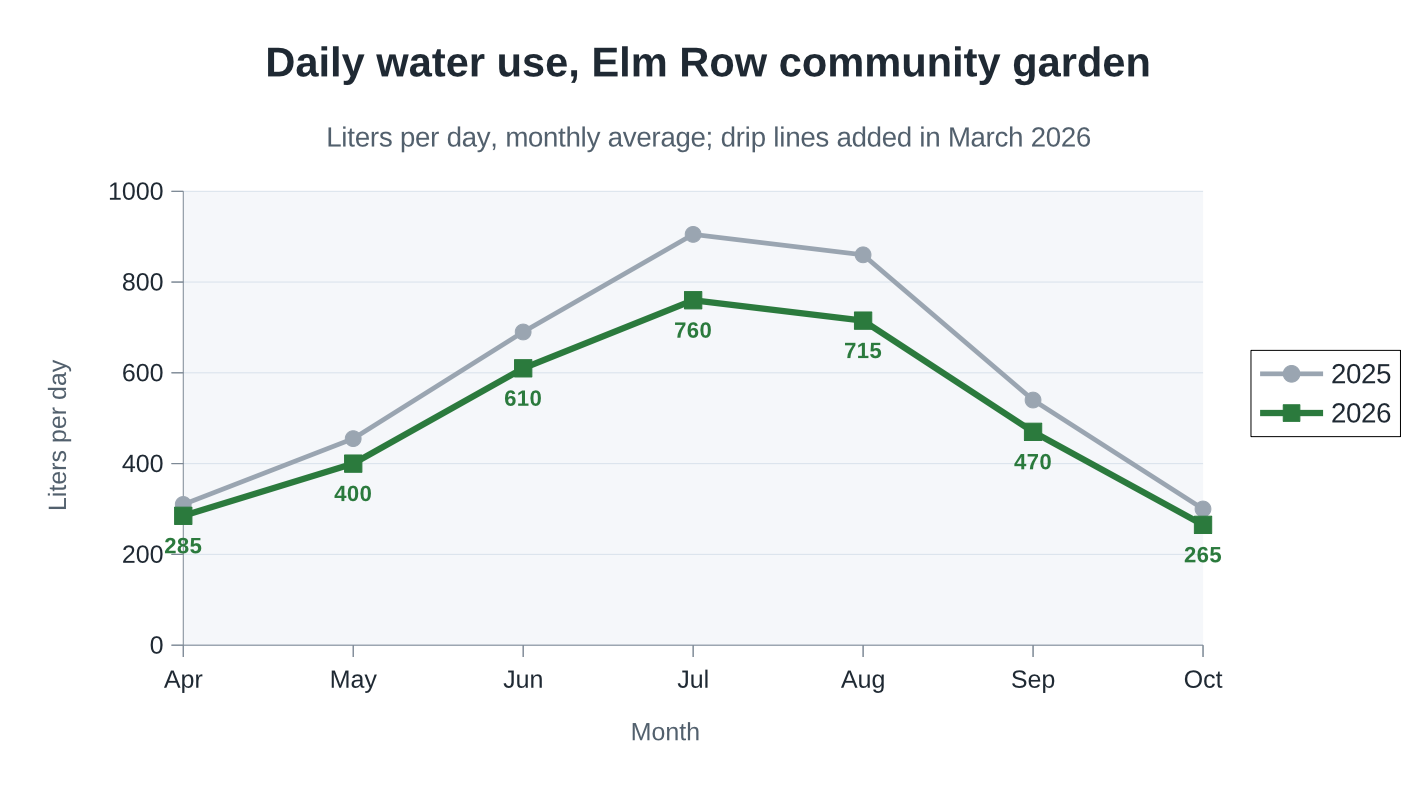
POST /v2/convert/odc/to/png draws a standalone OpenDocument chart as one PNG, cut to the chart's own size. The sample sends ImageResolution=200 and gets a 1,417 × 787 RGB image of 133,325 bytes with 200 DPI recorded in it.
- Endpoint
- POST /v2/
convert/ odc/ to/ png - Accepts
- odc
- Sample timing
- 0.545 s median of 5 runsHow we measure
- Request size
- Up to 10 MB on the Free plan or 100 MB on paid plans, all files together
Request and response
Every sample below ran against the API before this page was published. Set PDFCONVERSIONAPI_KEY to your key and run it as is.
curl -sS -X POST \
  https://api.pdfconversionapi.com/v2/convert/odc/to/png \
  -H "Authorization: Bearer $PDFCONVERSIONAPI_KEY" \
  -F File=@garden-water-use.odc \
  --form-string ImageResolution=200 \
  -o response.json

# FileData is base64. Save the first file in converted/,
# or print the JSON error.
if jq -e '.Files' response.json > /dev/null; then
  mkdir -p converted
  name=$(jq -r '.Files[0].FileName' response.json)
  jq -r '.Files[0].FileData' response.json \
    | base64 --decode > "converted/$name"
else
  cat response.json
fi
import base64
import os
import requests
key = os.environ["PDFCONVERSIONAPI_KEY"]
response = requests.post(
"https://api.pdfconversionapi.com/v2/convert/odc/to/png",
headers={"Authorization": f"Bearer {key}"},
files=[("File", open("garden-water-use.odc", "rb"))],
data={
"ImageResolution": "200",
},
timeout=180,
)
result = response.json()
if not response.ok:
raise SystemExit(f"{result['Code']}: {result['Message']}")
os.makedirs("converted", exist_ok=True)
for file in result["Files"]:
path = os.path.join("converted", file["FileName"])
with open(path, "wb") as out:
out.write(base64.b64decode(file["FileData"]))
print(path, file["FileSize"], "bytes")
import { mkdir, readFile, writeFile } from "node:fs/promises";
import { join } from "node:path";

const form = new FormData();
const file = "garden-water-use.odc";
form.append("File", new Blob([await readFile(file)]), file);
form.append("ImageResolution", "200");

const url = "https://api.pdfconversionapi.com/v2/convert/odc/to/png";
const key = process.env.PDFCONVERSIONAPI_KEY;
const response = await fetch(url, {
  method: "POST",
  headers: { Authorization: `Bearer ${key}` },
  body: form,
});
const result = await response.json();
if (!response.ok) {
  throw new Error(`${result.Code}: ${result.Message}`);
}

await mkdir("converted", { recursive: true });
for (const file of result.Files) {
  const path = join("converted", file.FileName);
  await writeFile(path, Buffer.from(file.FileData, "base64"));
  console.log(path, file.FileSize, "bytes");
}
{
  "ConversionCost": 1,
  "ConversionTime": 0.545,
  "Files": [
    {
      "FileName": "garden-water-use-1.png",
      "FileExt": "png",
      "FileSize": 133325,
      "FileData": "iVBORw0KGgoAAAANSUhEUgAA…"
    }
  ]
}
Response from our test run on 2026-11-03. ConversionTime shows the median of 5 runs. FileData is shortened here; the real response carries the whole file as base64.
The sample, converted
The same file the code sends. Download the input and the output and compare them yourself.
- Input
- garden-water-use.odc (2.7 KB)
- Output
- garden-water-use-1.png (130 KB)
- Source
- A line chart of a fictional community garden's daily water use, 2025 against 2026, which we wrote as an OpenDocument chart by hand (CC0-1.0). How it was made
- Made by
- 2026-11-04, API build
9eeeb0640aba
Parameters
Send these as form fields next to the file. Names are case-insensitive. If you set one of the documented options below that we don't support yet, the request fails with a 400 that names it instead of returning a file made without it.
| Parameter | What it does |
|---|---|
ImageResolutioninteger, default 150 | Pixels per inch of chart. ConvertAPI documents 200 as its default for this pair; ours is 150, which gives 1,062 × 590 for the 18 × 10 cm chart. 300 gives 2,125 × 1,181 and 211,556 bytes.Values: 36–600 |
ImageWidthinteger | Width in pixels: 640 gave a 640 × 356 chart of 51,562 bytes.Values: 1–20000 |
ImageHeightinteger | Height in pixels; the width follows the chart's 18:10 shape.Values: 1–20000 |
ScaleProportionsboolean, default true | With a 640 × 640 box the chart fits at 640 × 356. false stretches it to fill the square. |
ScaleImageboolean, default true | false crops the given size from the top-left corner instead of scaling. |
ScaleIfLargerboolean, default false | true stops upscaling: ImageWidth=4000 then leaves the chart at 1,062 pixels. |
TransparentColorstring | Clears one exact color. white at 200 DPI cleared 619,330 of 1,115,179 pixels, the chart background, while the light gray plot area stays.Values: color name, #RRGGBB or R,G,B |
BackgroundColorstring, default white | Documented by ConvertAPI for this pair, but the chart is drawn on its own white fill, which covers the whole image. black left the PNG pixel for pixel the same at 150, 200 and 300 DPI and at ImageWidth=1200. Use TransparentColor instead. |
ColorSpaceenum, default default | gray writes a one-channel PNG: 37,120 bytes at 150 DPI. rgb gives the same 95,821-byte file as the default, which has no alpha channel. gray with TransparentColor=white writes gray plus alpha: 46,479 bytes.Values: default, rgb, gray, monochrome |
FileNamestring | Stem of the file name; the chart comes back as <stem>-1.png. |
StoreFileboolean, default false | Store the PNG and return a link that expires after 3 hours. |
Not supported yet
Setting one of these to anything but its default returns 400.
| Option | What to do instead |
|---|---|
PageSize | 400 "PageSize is not supported yet for ODC files"; the image always covers the chart only. |
What carries over, and what doesn't
Kept
- The chart's proportions: 18 × 10 cm stays 18:10 at every resolution
- Series colors, square and circle markers, gridlines, the legend and value labels, drawn with smooth edges
- The DPI you ask for, in the PNG's pHYs chunk: the sample records 200 × 200
- Three color channels and no alpha channel;
TransparentColoradds one
Lost or not yet supported
- Text as text: titles and labels become pixels.
- Clean transparency at the edges:
TransparentColor=whiteclears only exactly white pixels, so the soft edges of text keep a pale fringe. - A background color of your choice: the chart's white fill covers the image, so
BackgroundColorleaves it white.
Limits
- Images up to 100,000,000 pixels and 16,000 pixels per side; larger sizes return 413.
- A chart is one image;
PageRangeaccepts only1. - A chart saved with a password returns 422 "the input file is password-protected" when no
Passwordis sent, and 400 "password-protected ODC files are not supported yet" when one is. With an unprotected chart,Passwordchanges nothing: the same 95,821-byte PNG comes back. - Up to 10 MB on the Free plan or 100 MB on paid plans per request and 120 seconds per conversion.
Where teams use it
Chart images in dashboards and docs
A job that produces .odc charts can publish them as PNG in a dashboard, a README or a status page. The image is the chart alone, with no page around it.
Slides and handouts
ImageResolution=200 or 300 gives the chart more pixels for a slide deck or a printed handout: 300 DPI is 2,125 × 1,181 pixels for an 18 cm wide chart.
Charts on colored backgrounds
TransparentColor=white removes the white chart background so the lines and labels sit on a web page or slide color.
Questions
Why is the default 150 DPI and not 200?
We draw all document pages at 150 DPI unless you send ImageResolution. Send ImageResolution=200 for ConvertAPI's documented default, which is what the sample does: 1,417 × 787 pixels.
Can I get the chart with a transparent background?
Yes, with TransparentColor=white. At 200 DPI it cleared 55.5% of the sample's pixels. The plot area, filled #F5F7FA in the chart, stays visible.
How do I get an exact pixel width?
Send ImageWidth. The chart is drawn at the scale that width needs, so 640 gives 640 × 356 directly, not a resized larger image.
Convert your first ODC file in a minute.